OBJECTIVES
During the project, seven objectives will be met:
01 Compare driversthat lead to groundwater depletion (climatic/non-climatic).
02 Modeling the snow process and assessing the contribution of snowfall to groundwater recharge.
03 Multi-modeling and mapping of groundwater depletion and its impacts in four aquifer systems in Greece
and Italy using various groundwater simulation techniques.
04 Estimation of the additional costs of pumping groundwater due to groundwater depletion for energy
(cost-benefit analysis).
05 Selection of the optimum managed aquifer recharge (MAR) method (e.g. riverbank filtration, infiltration
ponds, injection wells) and optimization of the MAR process by combining the surface and groundwater
simulation in order to improve groundwater quality and quantity.
06 Development and testing of integrated software that optimizes the operation of dams for hydropower
energy production and water provision for groundwater artificial recharge.
07 Translate research findings to policy recommendations that could trigger improvements in existing
relevant legislation.
WORK PACHAGES_
WP1:Project Management.
Management of the overall activities of the project
WP2:Measurement network – Data Elaboration
WP2 will focus on: a) the Creation of the project’s database, b) Collection of new field data, literature review, c)
Establishing the vadose zone monitoring stations for groundwater recharge, d) Performing initial field
measurements and elaborate meteorological data
WP3:Monitoring and model development – Interpretation
WP3 will focus on the: a) Collection of field data and measurements, b) Development of the code for dam operation,
c) Development and testing of software interface, d) Development of conceptual models for all four
aquifer systems, e) Determination of meteorological variability, e) Development of snow algorithm.
WP4: Lab work – Interpretation
WP4 will focus on the: a) Chemical and isotopic analyses, b) Creation of thematic maps, c) Supplement simulation
models with the available new data, d) Preparation submission of a special issue proposal.
WP5: Simulation – Interpretation
WP5 will focus on: a) To complete all simulation processes: Groundwater, surface water, vadose zone, MAR
scenarios in conjunction with dam operation. Selection of the optimal method and scenario for MAR in
each study site. b) Quantification of groundwater depletion and all involved parameters. c) Estimation of
increased cost for pumping due to groundwater depletion. d) Finalization of software simulating non-
powered dams and testing it in study area 3 (Italy). e) Preparation and submission of two papers in
scientific journals and one in an international conference.
WP6: Communication and Dissemination
WP6 will aim to increase the visibility of projects results
Deliverables:
D1
D2
D3
D4
D5
D6
Description of the sites
1.1 Campania region
The Upper Volturno and Calore basin is located in the Campania region (on the Tyrrhenian side of the Southern Apennines, Italy). The study area is about 5.613 km 2, while the altitude varies from 16 m to 2118 m. The mean annual temperature is 16.4 ℃ and the mean annual rainfall is 1245 mm. The geological setting of the Upper Volturno-Calore basin consists of dolomites, limestones, sandstones, clay-marl flysch, and pyroclastic fall deposits (Figure 1.1). The main aquifer is hosted in alluvial formations with a mean thickness of 80 m. The elevation varies from 15.5 m and 2.102 m (Figure 1.2a). Agricultural and livestock activities are mainly located in the lowlands, whereas mixed forests and pastures constitute the land cover of the mountainous part. The main crop types are vineyards, cereals, vegetables, and orchards (Figure 1.2b).
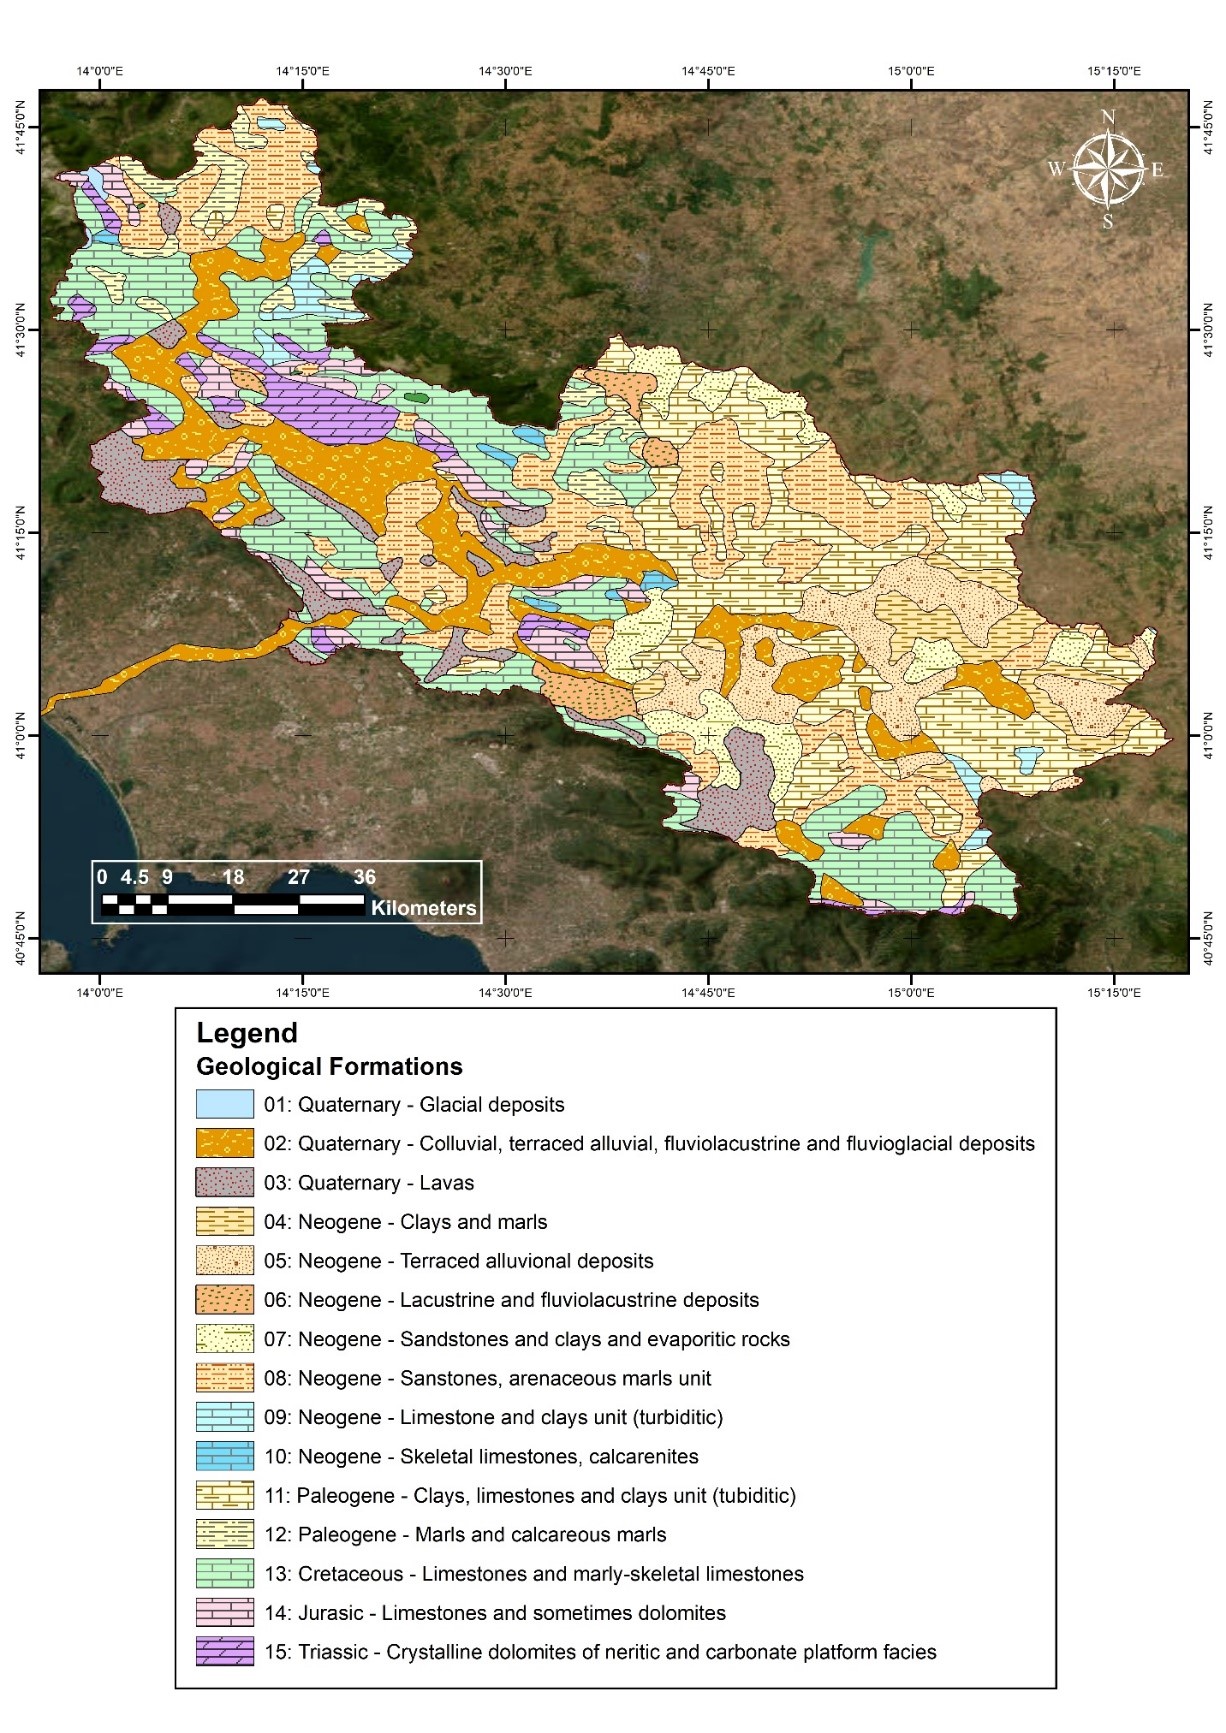
Figure 1.1 Geological map for Upper Volturno-Calore basin
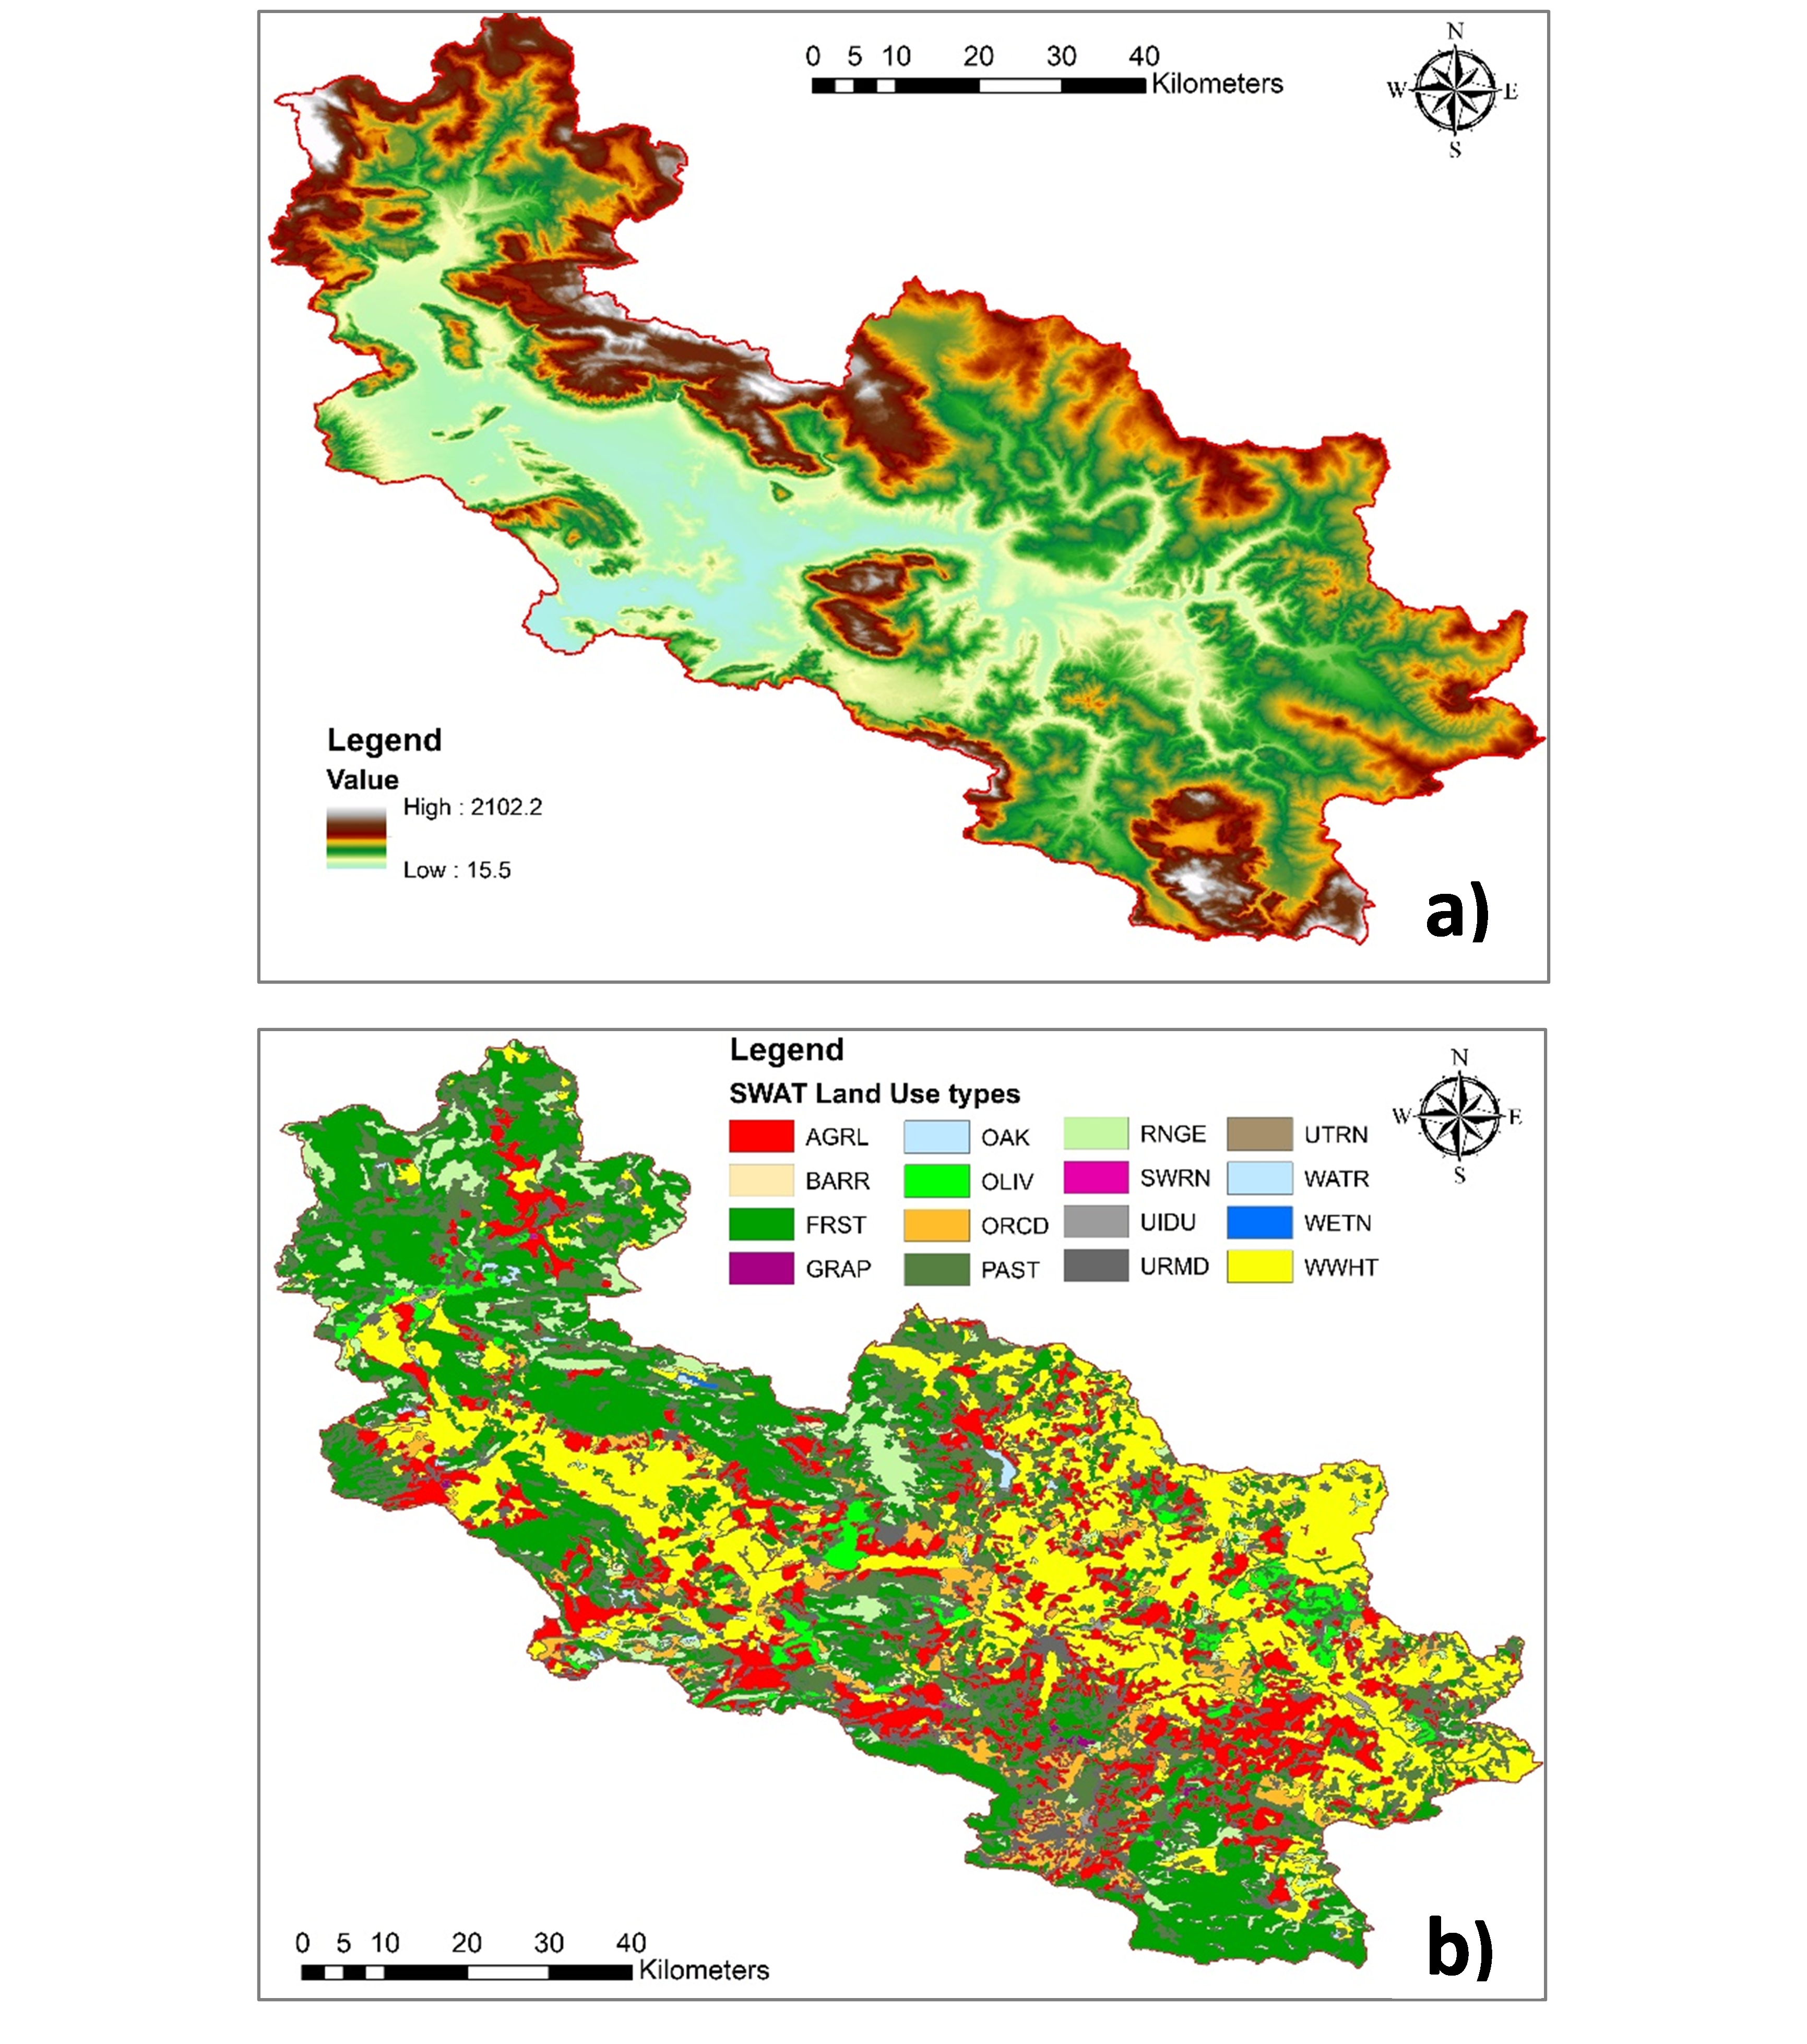
Figure 1.2 Geological Aquifer for Upper Volturno-Calore basin
1.2 Anthemountas basin
Eastern Thermaikos Gulf is located in northern Greece. The basin covers an area of 932.7 km 2, with altitudes ranging from 0 m (coastal zone) to 1199 m a.s.l (Mount Hortiatis) (Figure 1.3). The climate is a typical Mediterranean semi-arid climate with dry summers and wet winters. The mean annual temperature and precipitation values are 15.1°C and 575 mm, respectively.
The geological setting of Anthemountas basin is presented in Figure 1.4.The basin is characterized by a multiple aquifer system consisting of various aquifer types: i) a porous aquifer hosted in the Quaternary and Neogene sediments, ii) a karst aquifer located in the south-central part of the basin, and iii) fractured rock aquifers in the mountainous part of the basin.
Agriculture is the primary economic activity of the area, although tourism has increased in recent years, mainly during the summer. The area’s main crops include vegetables, olives, wine grapes, corn and cereals (Figure 1.5). The area’s growing domestic and irrigation water requirements are met by numerous boreholes located in the porous aquifers. Due to overexploitation, groundwater depletion has been observed in the aquifer.
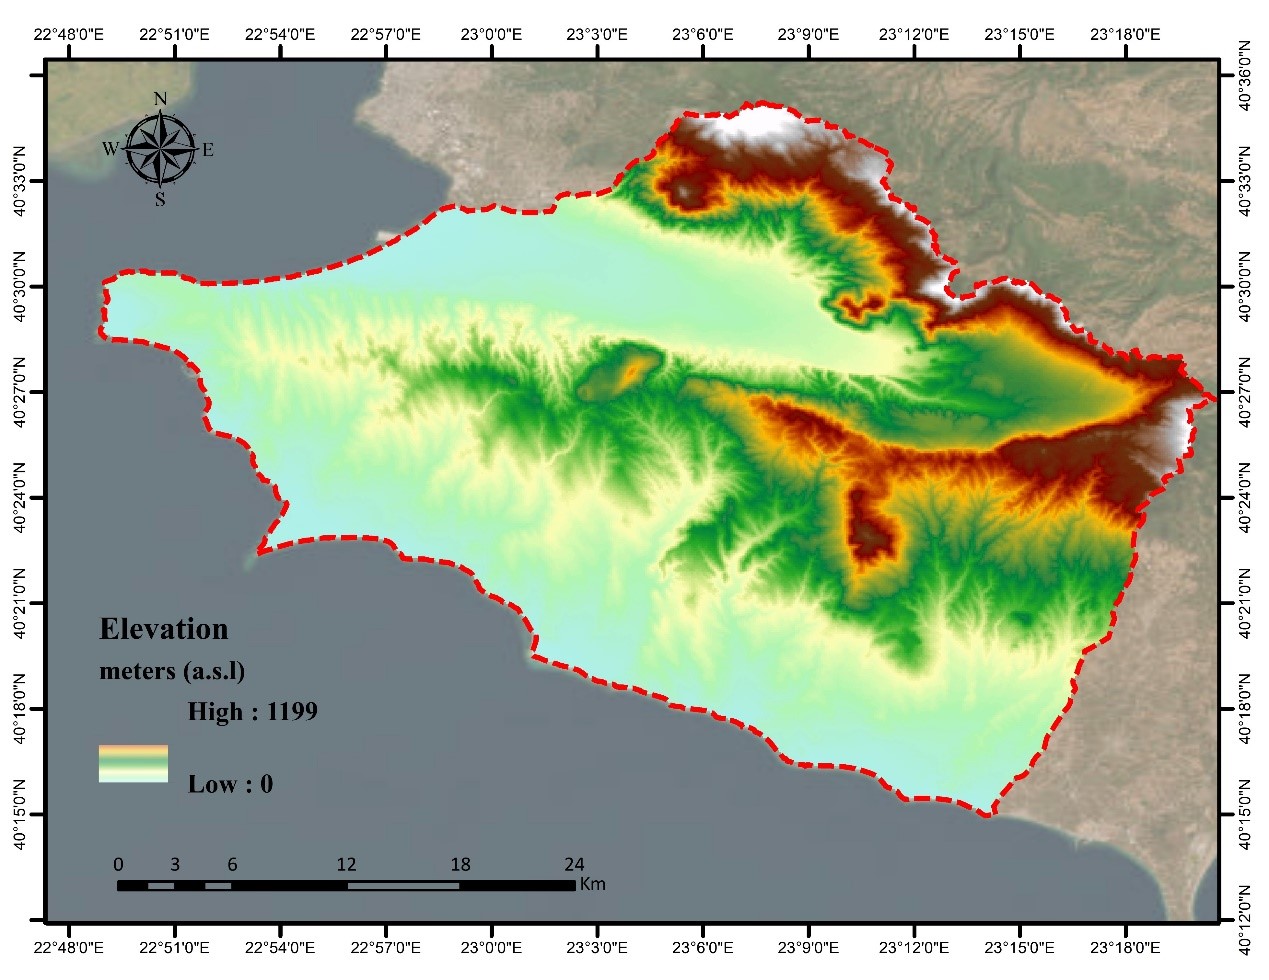
Figure 1.3 Spatial distribution of elevation in Eastern Thermaikos Gulf
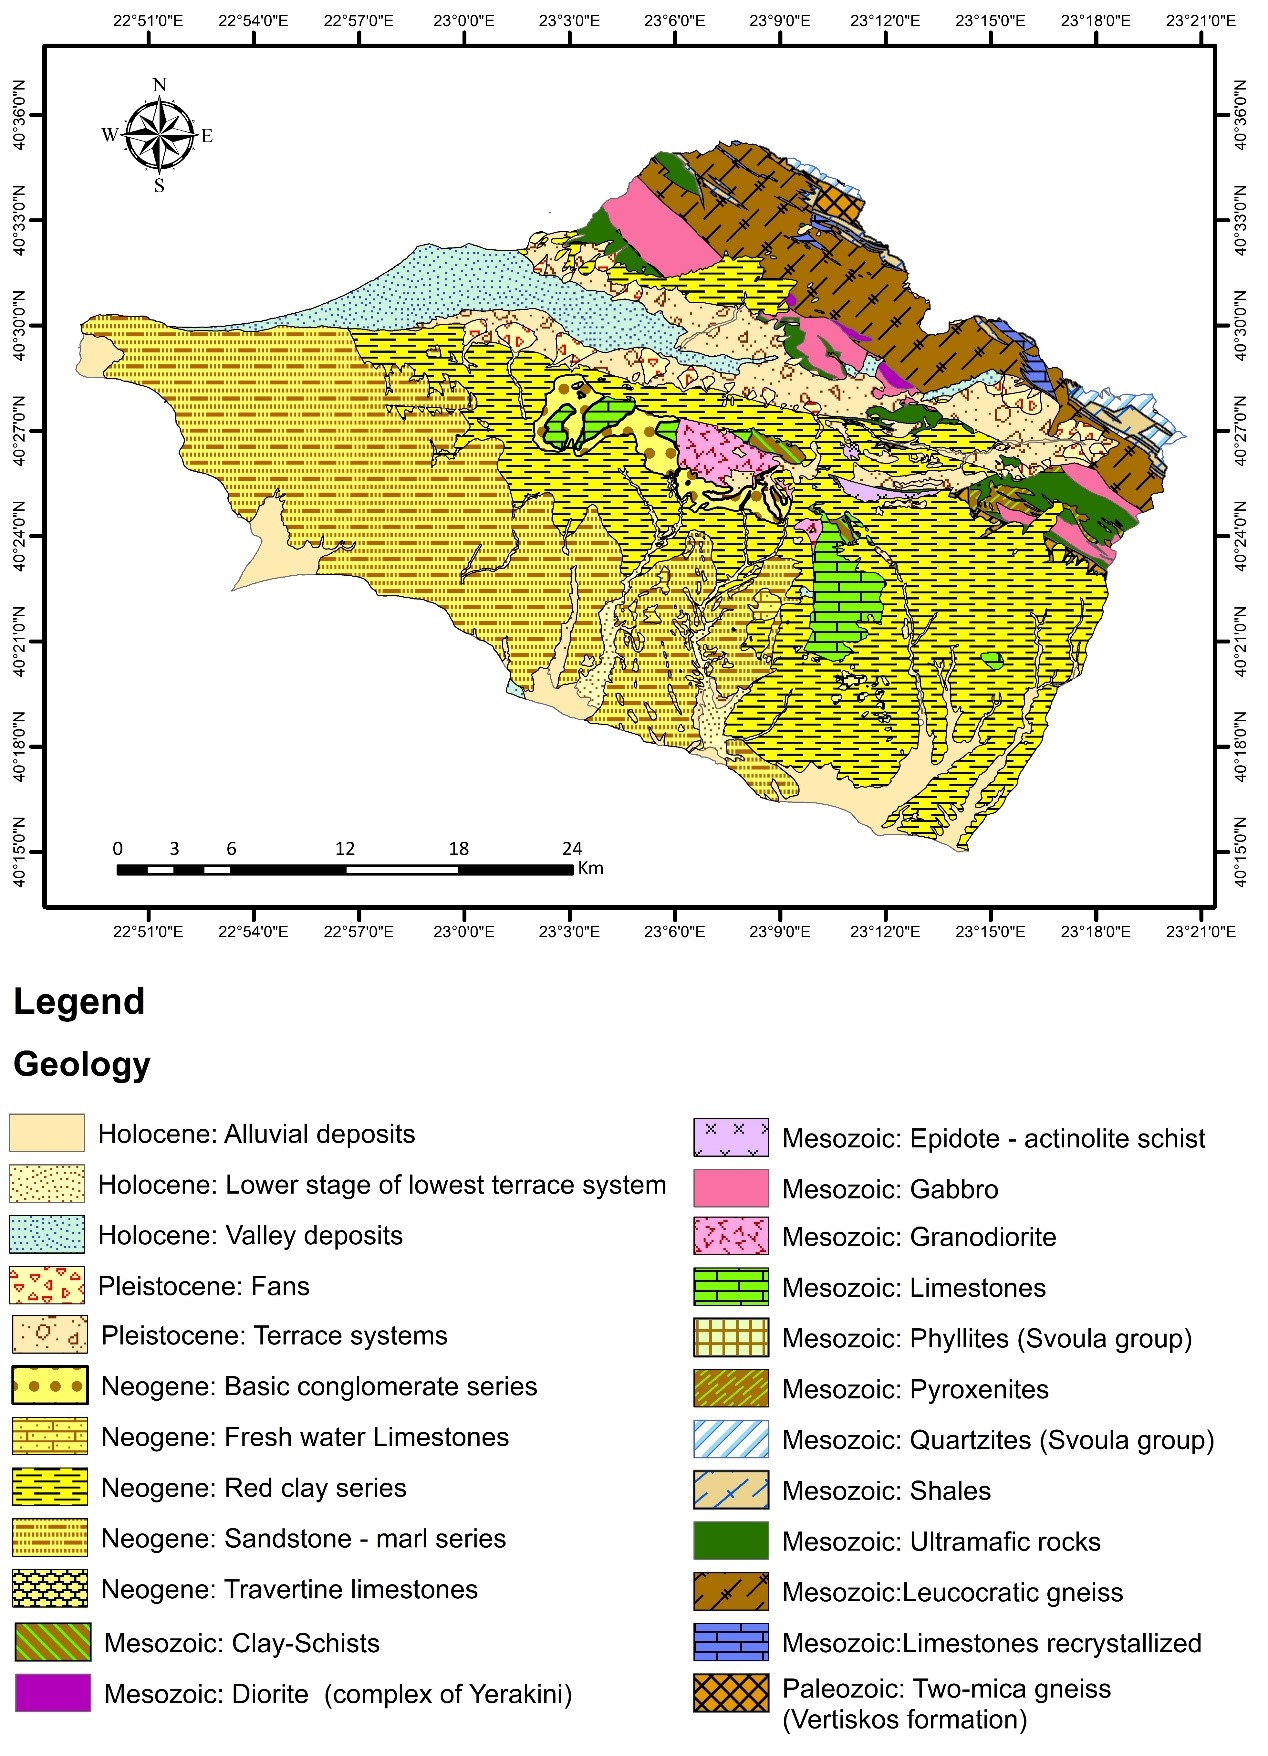
Figure 1.4 Geological map for Eastern Thermaikos Gulf
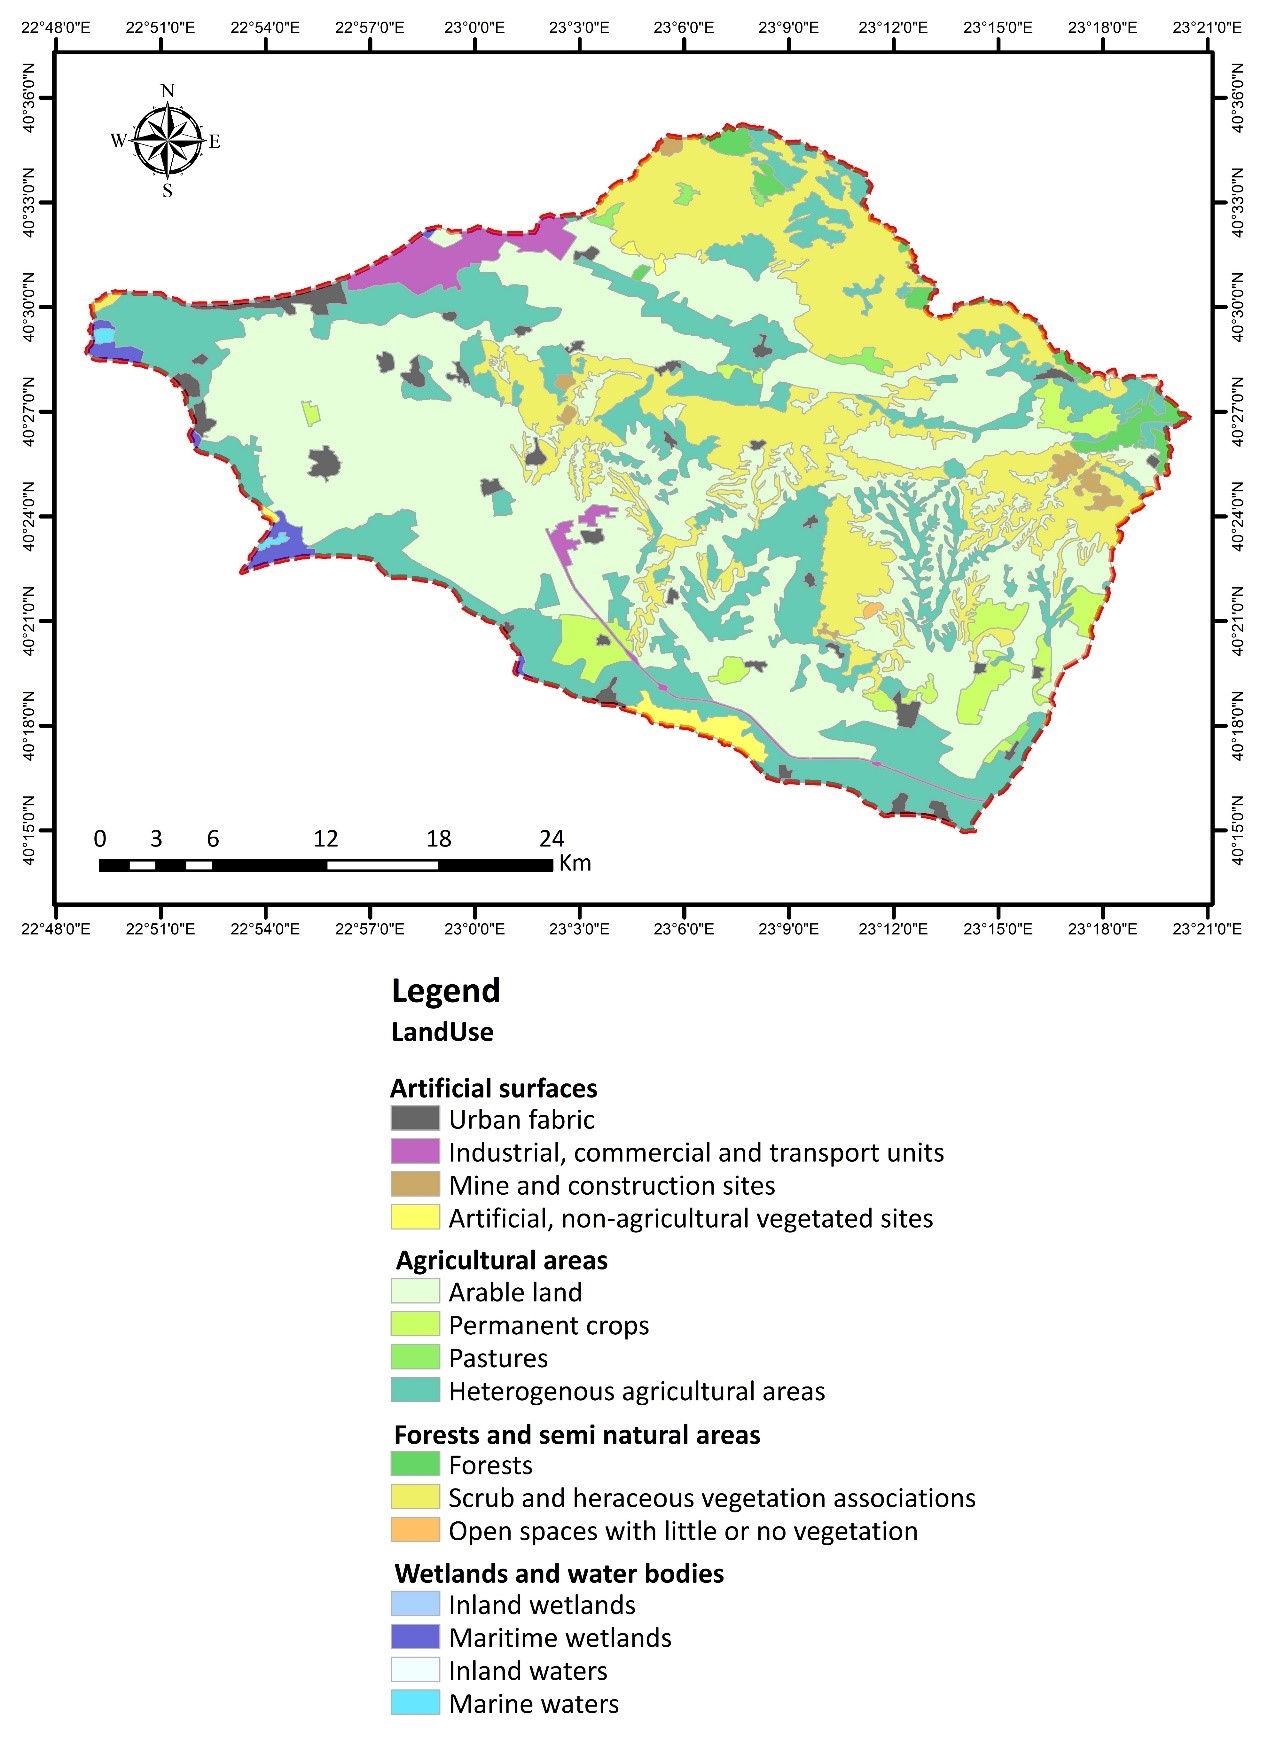
Figure 1.5 Spatial distribution of land use dominance in Eastern Thermaikos Gulf
1.3 Mouriki basin
The Mouriki basin is located in the north part of Kozani Perfecture in northern central Greece (Figure 1). It is an inland basin with a surface area of 110 km
2
. The climate is semi-arid Mediterranean with moderate rainfall during summer. The average annual air temperature and precipitation values are 11.2ºC and 636 mm, respectively. The geological setting of the study area is presented in Figure 1.6.
The main aquifer system is hosted in alluvial deposits with a mean thickness of 60 m covering an area of 30.5 km 2. The groundwater flow follows the local morphology moving towards the lowlands in an SSW to NNE direction. The mean altitude of the study area is 874.5 m a.s.l. with a mean slope inclination of 26.1% (Figure 1.7b). Livestock and agriculture are the main activities in the area and the main cultivations are corn, cereal crops, fruit trees, vegetables and legumes. The mountainous part of the basin is covered with mixed, coniferous forest vegetation (Figure 1.7a).
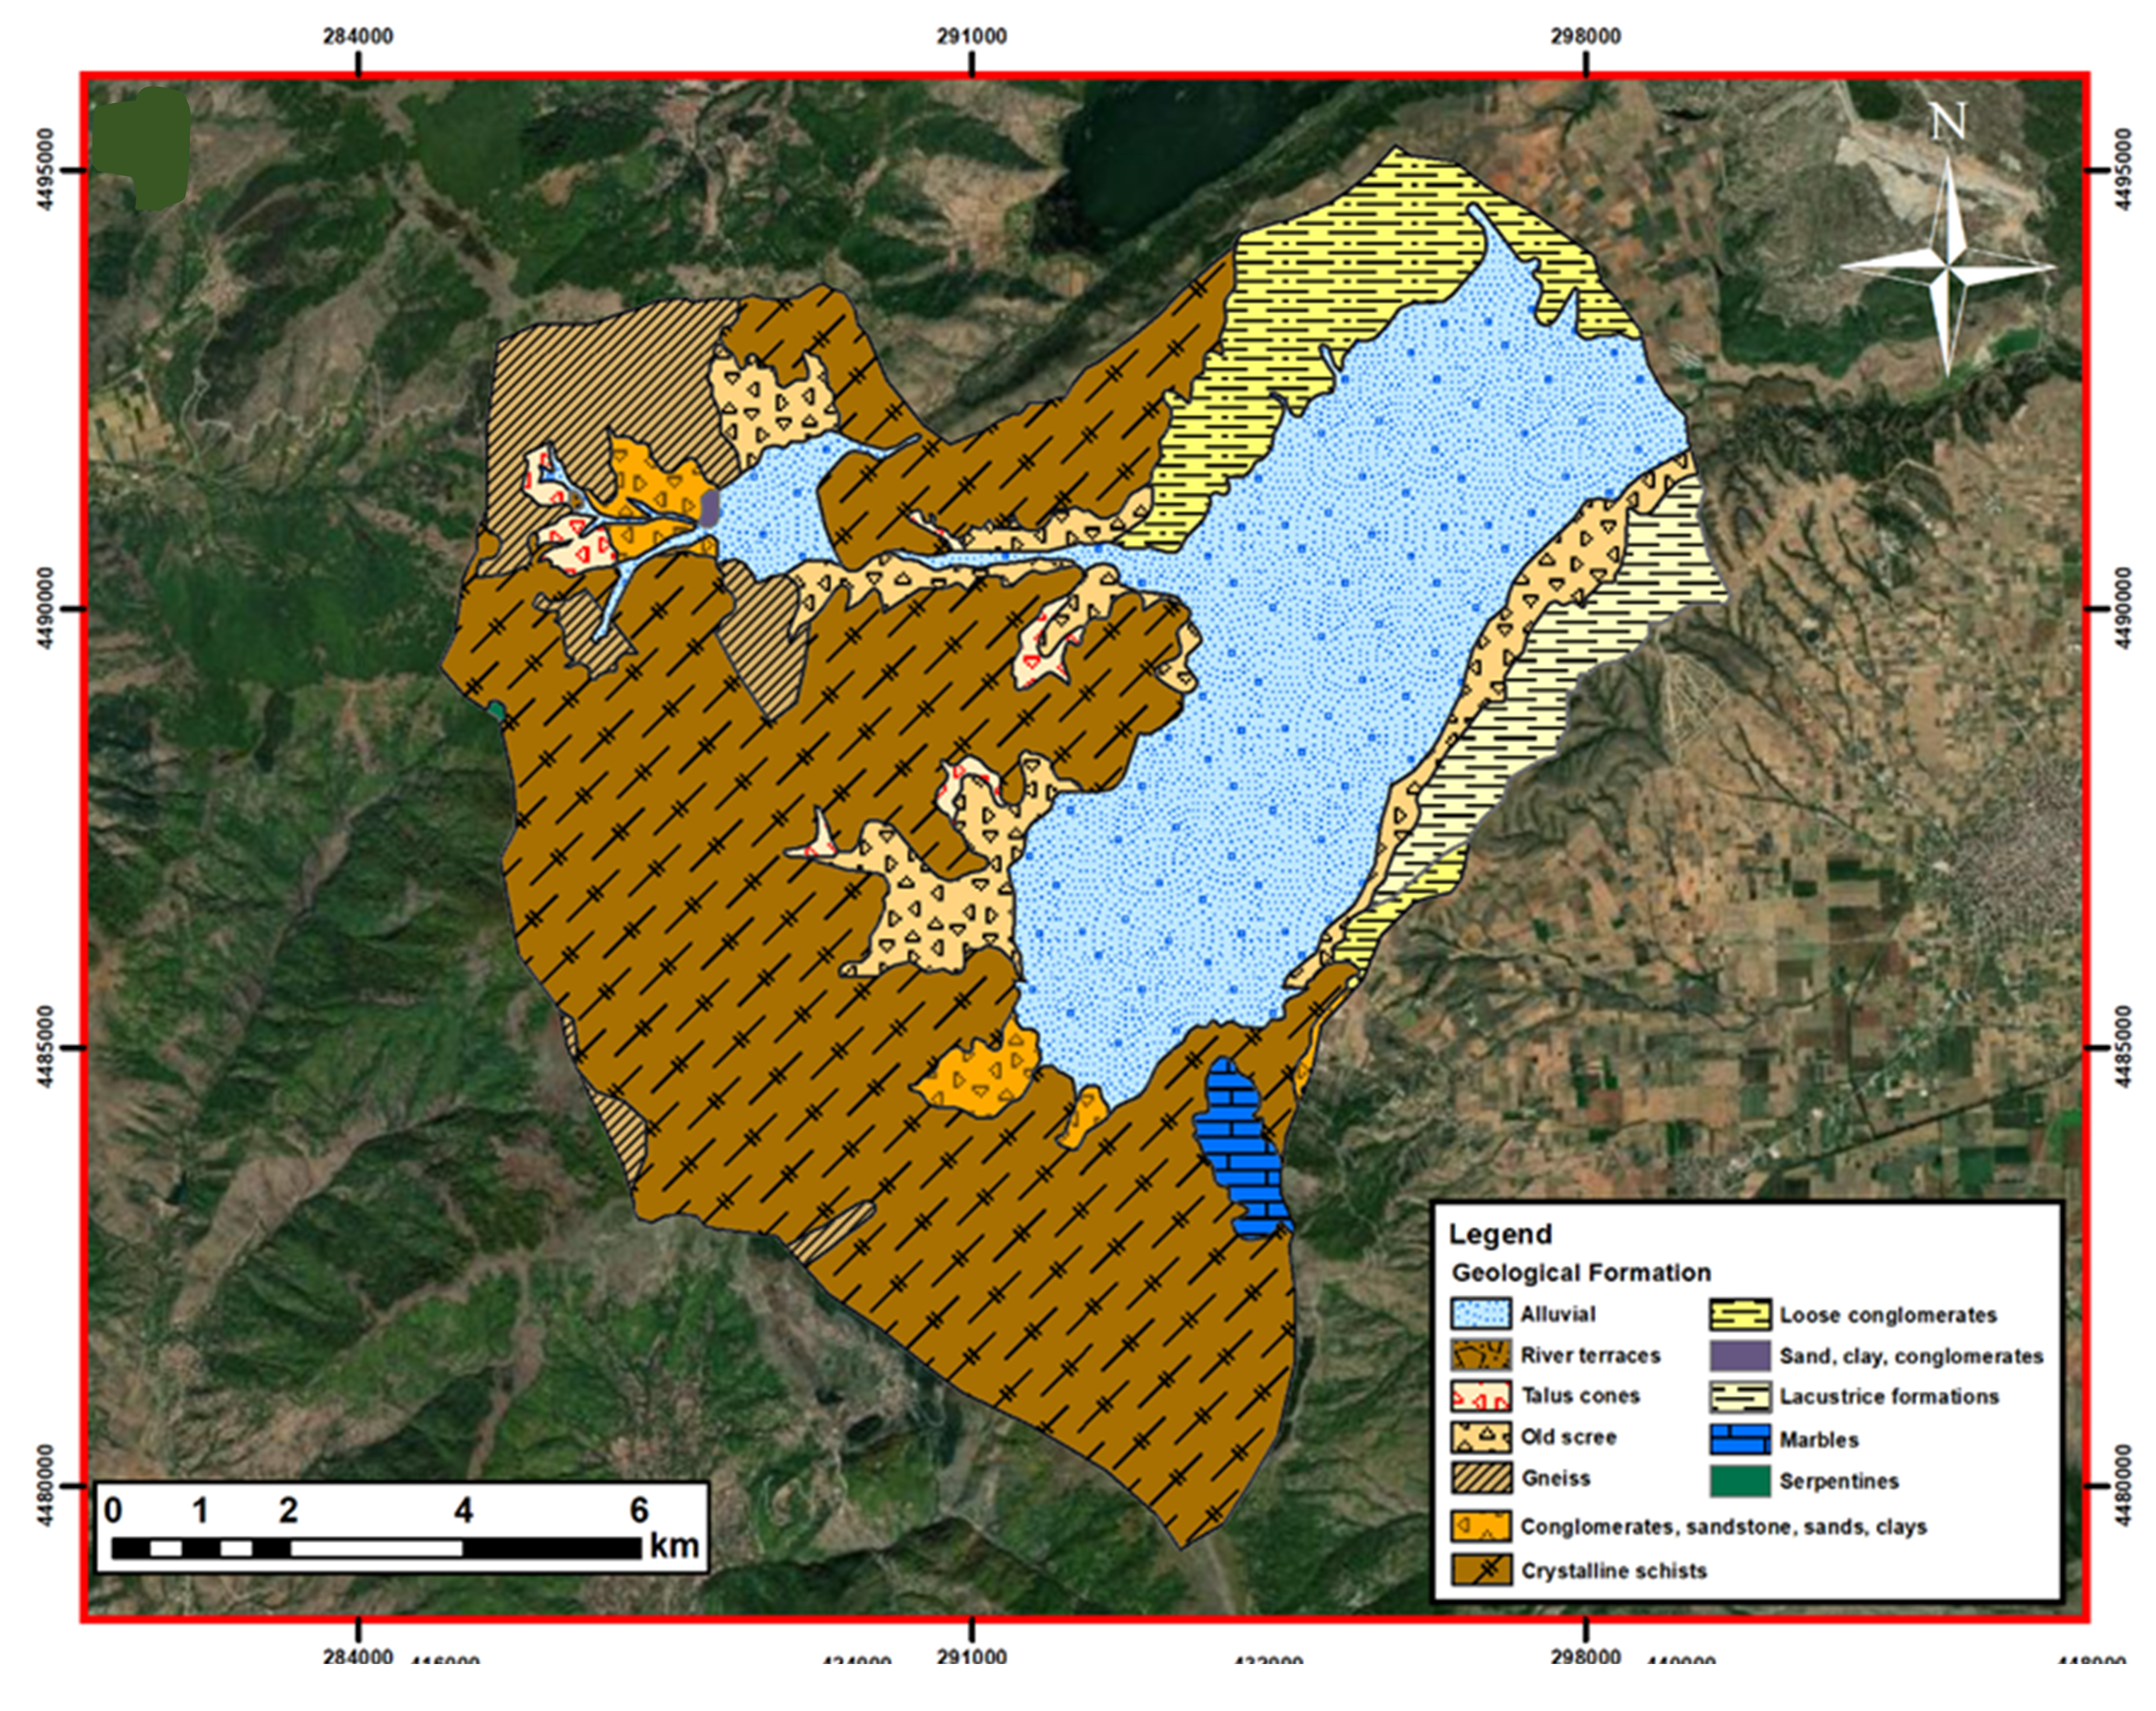
Figure 1.6 Geological map for Mouriki basin
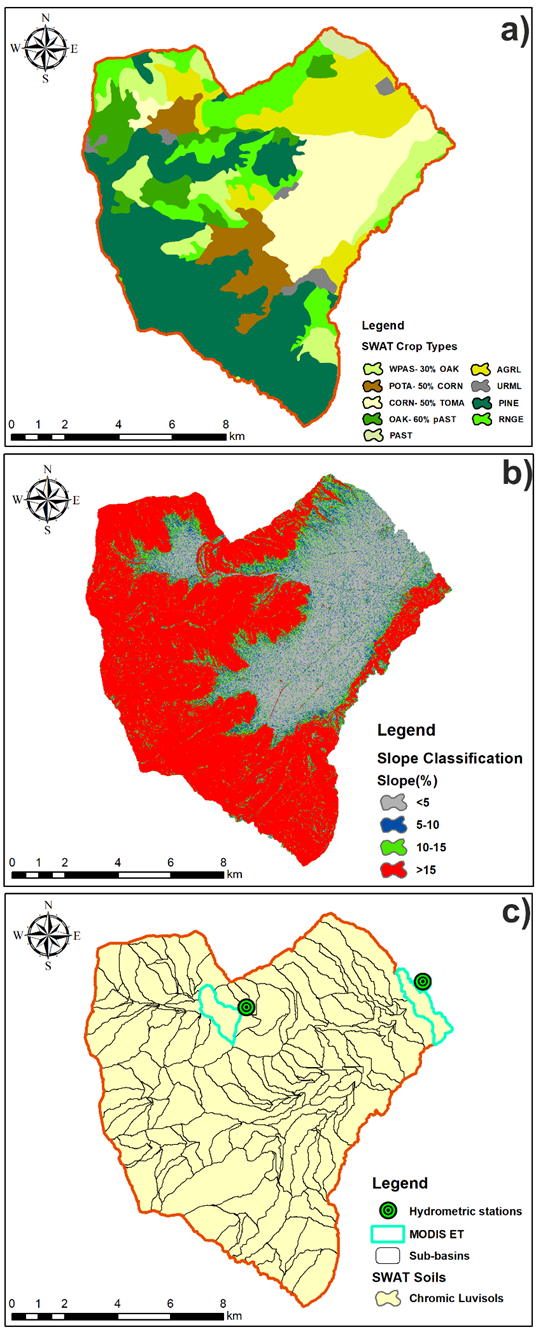
Figure 1.7 Spatial distribution of land use dominance (a) and slope classes (b) in Mouriki basin
1.4 Marathonas basin
The plain of Marathonas is located in the eastern part of Attica, southern Greece. The basin covers an area of 182.6 km
2. The elevation ranges from 0 m to 1407 m and is characterized as flat with gentle slopes in the central part and semi-mountainous to mountainous in the limits with the mountainous mass of Parnitha (Figure 1.8). The area is characterized by numerous environmental protection zones such as the national park of Parnitha and the mountain range of Penteli which are extended around the basin of Marathon. The average annual air temperature and precipitation values for the period 2011-2020 are 15.7 °C and 477.4 mm, respectively. The study area is classified in the Attic-Cycladic zone of the Aegean. The geological formations are divided into alluvial deposits, marbles-limestones, schists, and serpentines. Intensive erosion phenomena and small-scale soil movements are presented in the area due to the erosive nature of the formations. A porous aquifer is in the coastal area of the site, whereas karstic aquifers are found in areas underlain by marbles.
The main part of the region is covered by urban areas, forests (pine, mixed forest, sclerophyllous vegetation), shrubs, oak, pasture, cultivated fields, and wetlands (Figure 1.9) with spatial and temporal variations in their extent during the last years while devastating fire destroyed a notable part of the vegetation in 2009. Groundwater is mainly used for domestic use and irrigation in the sub-urban coastal zone. Both aquifers are subjected to intense pumping due to extensive agricultural activities, with an extended irrigation period (greenhouses) in most of the plain
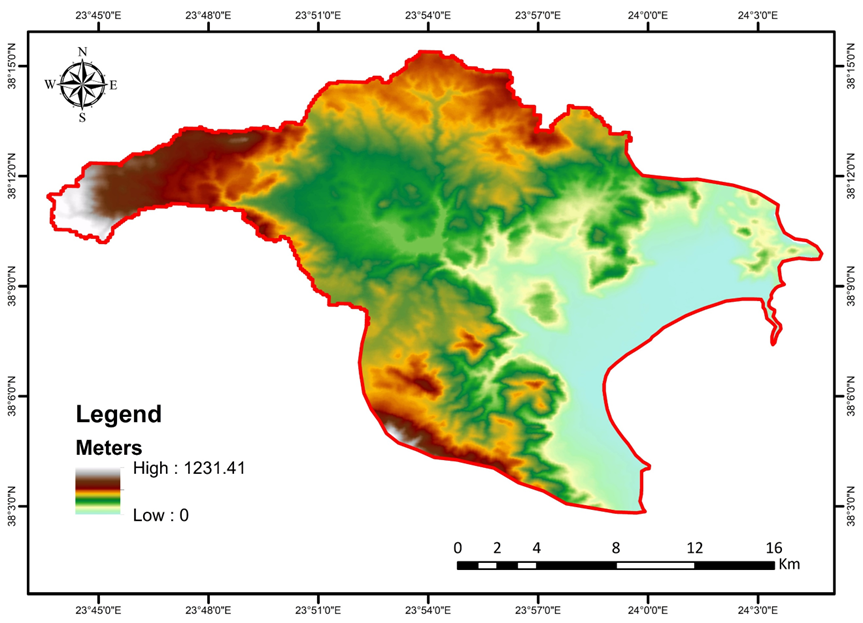
Figure 1.8 Spatial distribution of elevation in Marathonas basin.
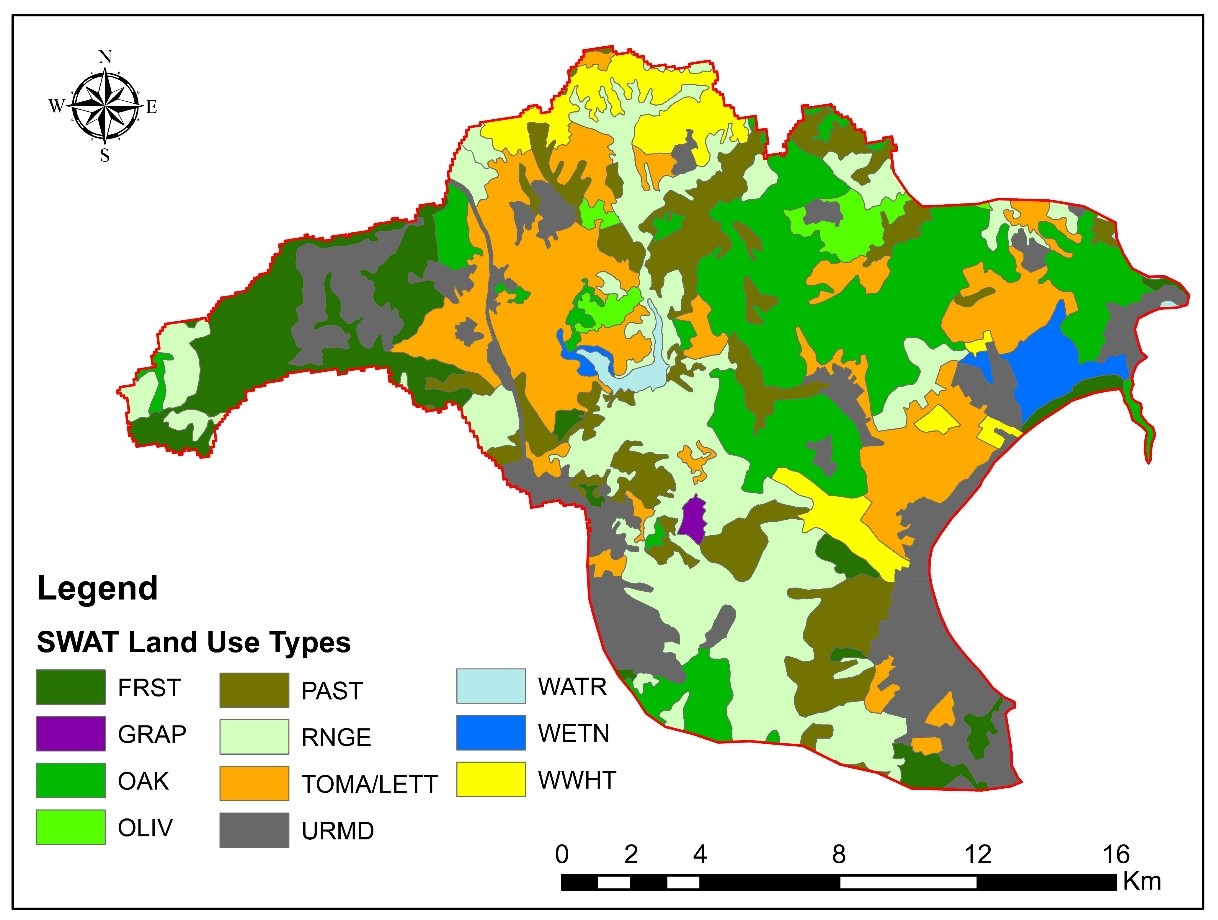
Figure 1.9 Spatial distribution of land use dominance in Marathonas basin.